Surrey transportation: Two tweets of serious interest
Two items of note from today’s Metro Vancouver transportation committee, both delivered via twitter.
and
First of all, we can that plenty of people aren’t keen on paying a toll to drive over a bridge, no matter what impact driving over the Pattullo might have on their daily commute.
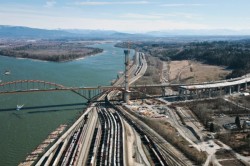
The second shows us just how challenging the next 30 years are going to be, whether we like it or not.
(Photo: Jason Sanders)
Trains for Surrey: Light rail is far from the perfect solution to reducing congestion – Cardiff University study
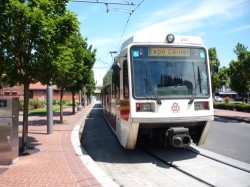
An interesting report over at The Atlantic Cities on a UK study about the impact of light rail on commuter mode-choice.
The study by researchers at Cardiff University has found that simply building light rail doesn’t seem to reduce car usage:
Growing rail shares in the light rail corridors have mainly come from buses and the evidence for light rail reducing car use is less clear. This latter finding is of particular significance, given that a major justification for investment in light rail rather than bus schemes is their presumed ability to bring about major modal shift by attracting substantial numbers of car users.
The researchers found that what light rail does do is reduce usage loads on buses:
A similar new study of British light rail systems comes away far less hopeful. In an upcoming issue of the Journal of Transport Geography, planners Shin Lee and Martyn Senior of Cardiff University found that the evidence for light rail reducing car use is unclear. Lee and Senior discovered that car ownership and car commute share often continue to rise in these corridors, and that ridership growth is often the result of travelers shifting over from buses — not cars.
For their study, Lee and Senior look at four light rail systems completed from 1991 to 2001: the Manchester Metrolink (built in two phases), the South Yorkshire Supertram, and Midland Metro, and the Croydon Tramlink. To determine the impact these lines had on their respective corridors, the researchers located nearby “control” areas to represent travel behavior that might have occurred if the systems hadn’t been built. The control and light rail areas had similar car ownership levels before 1991, similar rail commuter shares, and a similar distance to nearby city centers.
The Atlantic’s Eric Jaffe does not some concern about aspects of the study but also finds an important lesson:
The work makes a good contribution to our understanding of urban transit, but it has some severe caveats. The study’s biggest limitation is that it focused on the simple existence of light rail — not the quality of its service, or for that matter other factors like density or development or demographics. In the case of the Midland corridor, for instance, all of the findings are compromised by the fact that a major road was built parallel to the light rail line; a city that creates an incentive to drive shouldn’t be surprised when people do.
With that in mind, the work still underscores some important lessons. For starters, it offers a sound piece of advice: cities considering a light rail system should strongly consider whether improving the local bus system would be cheaper and just as effective. It also provides yet another reminder of the irrational love people have for their cars; getting city residents to give up driving often requires more than just offering them a ride.
Anyone who has observed commuters in the Lower Mainland can cite plenty of people who still drive despite having a viable transit alternative.
Surrey’s transportation planners should keep this in mind.
We fear density, but at what cost?

A great piece from the Toronto Star’s Christopher Hume on the challenges brought forth by both density and sprawl.
The very word conjures up visions of shadowy canyons of bleak high-rise apartment buildings and over-crowded buses lurching along congested streets. It inspires fears of endless line-ups, cavernous waiting-rooms and no place to sit.
But density also means the museum, art galleries, film festivals, Nuit Blanche and major league sports. It includes some of the best universities in the world, not to mention countless restaurants, shops and amenities, everything from skating rinks to pools to….
Density generates economic activity, i.e. jobs and wealth. And in the 21st century, as never before, the business of the world is transacted in large urban centres.
How our view can change: parking lots
Recognize this view?

You’ve seen it, many times.
Hint: it’s downtown.
Another hint: the big apartment block isn’t there anymore.
Third hint: it’s not a parking lot anymore.
Still stumped?
Here’s a high up view of what it looks like now:

Yes, our parking lot from 1973 is, in fact, now Robson Square.
Amazing how space can change, eh?
So, back to Surrey. That’s what Vancouver did; is there a spot in Surrey that you’d like to see undergo a similar transition?
(Oh, and that first pic? It’s a screen grab from a fascinating 1973 NFB short on Stanley King’s work with downtown Vancouver residents in re-designing what would become Robson Square.)
Chairs for Lovers by Barrie Howells, National Film Board of Canada
Surrey transportation policy a reflection of simple math

The gridlock’s already there, so the impetus towards alternatives to cars was obvious. But is it possible that Surrey’s density plans are reflective of trends in car ownership?
Diane Watts has been asking for other options for some time now. In her state-of-the-city address last March, Watts said that current trends suggested a 50 per cent increase in car licences by 2040, but with only a 12 per cent increase in road bed.
Like every major city has ever asked, the question is ‘where do we put all the cars?’
But hope may actually lie in demographics. That growth in licences may change. From the Report on Business in August:
According to the U.S. Department of Transportation, just 28% of 16-year-olds and 45% of 17-year-olds had driver’s licences in 2010 (the most recent data available). In 1978, the corresponding figures were nearly half and more than two-thirds. A trend is in place, evidently. This past spring, the U.S. Federal Highway Administration (FHA) reported that the proportion of 14- to 34-year-olds without licences rose to 26% in 2010 from 21% in 2000. Research done by the Frontier Group and the U.S. PIRG Education Fund found that the use of public transportation by Americans between the ages of 16 and 34 climbed by 40% between 2001 and 2009.
Similar trends are in place in Canada, Australia, Europe and Japan. The Japanese call it “demotorization.” Cars used to be status symbols. Now, they’re becoming unaffordable burdens.
There are simply not going to be as many drivers in the future as there were in the past. The generation that is moving into prime adulthood simply does things differently from their parents and that trend should be matched by policy.
For Surrey, it makes a whole lot of sense. Looking at the number from the 2006 census, we see that Surrey had a large population advancing forward in age. Those are the baby boomers, whose car use, as mentioned above, is historically much higher than that of their children.

From the City of Surrey’s 2006 Census demographics report (pdf).
See that bubble in the 20-24 range and below? Those are the young people we speak of. This is from six years ago, so the leading edge has entered their thirties and are having kids. Cost of living is a huge factor for them – if they can get by without a car, they’ll be supremely happy.
It’s also worth noting that Surrey has one of the highest percentages of people aged 0 to 19 in the region:

– Johnston
Complete street lessons from NYC to Surrey, BC
Prompted by Gordon Price’s little post on PriceTags…
Here’s some grist for the mill on how density can allow for substantial changes to a pre-existing, high-use multi-lane roadway.
Columbus Circle in New York has had some serious alterations in traffic flows:


You can probably guess which was before and which is now.
The project was initiated as part of what the NYC Department of Transportation called Green Light for Midtown. Along with creating a massive pedestrian mall in Times Square, the above alterations were made leading from Columbus Circle.
The project was based on a feasibility analysis that indicated it would improve traffic flow on 6th and 7th Avenue and improve traffic safety along Broadway.
The results have been impressive. As ever, it’s about having alternatives for people to use. Take out the cars, provide other means of transport.
–Johnston
